@TOC
前言
本文着力于介绍scikit-opt工具包中七大启发式算法的API调用方法,关于具体的数学原理和推导过程,本文不再介绍,请读者自行查询相关文献。
1.测试函数
为了检验这些启发式算法的效果,本文使用了以下五种专门用于测试的函数。
1.1 针状函数
1.1.1 表达式
f ( r ) = sin ( r ) r + 1 , r = ( x − 50 ) 2 + ( y − 50 ) 2 + e f(r)=\frac{\sin(r)}{r}+1,r=\sqrt{(x-50)^{2}+(y-50)^{2}}+e f ( r ) = r sin ( r ) + 1 , r = ( x − 50 ) 2 + ( y − 50 ) 2 + e 0 ≤ x , y ≤ 100 0\le x,y\le100 0 ≤ x , y ≤ 100 1.1.2 特征
该函数是一个多峰函数,在(50,50)处取得全局最大值1.1512,第二最大值在其全局最大值附近,采用一般的优化方法很容易陷入局部极大值点。
1.1.3 图像
1.2 Brains’s rcos函数
1.2.1 表达式
f ( x 1 , x 2 ) = a ( x 2 − b x 1 2 + c x 1 − d ) 2 + e ( 1 − f ) cos ( x 1 ) + e f(x_{1},x_{2})=a(x_{2}-bx_{1}^{2}+cx_{1}-d)^{2}+e(1-f)\cos (x_{1})+e f ( x 1 , x 2 ) = a ( x 2 − b x 1 2 + c x 1 − d ) 2 + e ( 1 − f ) cos ( x 1 ) + e a = 1 , b = 5.1 4 π 2 , c = 5 π , d = 6 , e = 10 , f = 1 8 π a=1,b=\frac{5.1}{4\pi ^{2}},c=\frac{5}{\pi },d=6,e=10,f=\frac{1}{8 \pi } a = 1 , b = 4 π 2 5.1 , c = π 5 , d = 6 , e = 10 , f = 8 π 1 1.2.2 特征
有3个全局最小值:0.397887,分别位于 (-pi, 12.275), (pi, 2.275), (9.42478, 2.475)。 还有一个局部最小值为:0.8447
1.2.3 图像
1.3 Griewank函数
1.3.1 表达式
f ( x ) = ∑ i = 1 N x i 2 4000 − ∏ i = 1 N cos ( x i i ) + 1 f(x)=\sum_{i=1}^{N}\frac{x_{i}^{2}}{4000}-\prod_{i=1}^{N}\cos (\frac{x_{i}}{\sqrt[]{i}})+1 f ( x ) = i = 1 ∑ N 4000 x i 2 − i = 1 ∏ N cos ( i x i ) + 1 − 600 ≤ x i ≤ 600 , i = 1 , 2 , . . . , N -600\le x_{i} \le 600,i=1,2,...,N − 600 ≤ x i ≤ 600 , i = 1 , 2 , ... , N 1.3.2 特征
在(0,0,…,0)处取得全局极小值0
1.3.3 图像
1.4 Easom’s函数
1.4.1 表达式
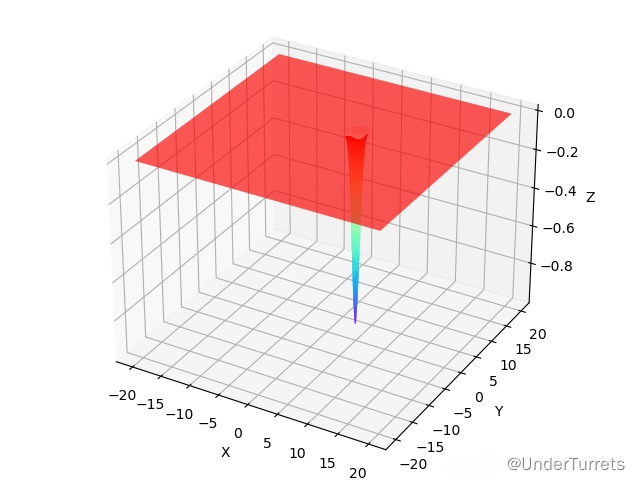
f ( x , y ) = − cos ( x ) cos ( y ) exp ( − ( x − π ) 2 − ( y − π ) 2 ) f(x,y)=-\cos (x) \cos (y)\exp (-(x-\pi)^{2}-(y- \pi)^{2}) f ( x , y ) = − cos ( x ) cos ( y ) exp ( − ( x − π ) 2 − ( y − π ) 2 ) − 100 ≤ x , y ≤ 100 -100 \le x,y \le 100 − 100 ≤ x , y ≤ 100 1.4.2 特征
在(pi,pi)处取得全局最小值-1。
1.4.3 图像
1.5 Schwefel’s函数
1.5.1 表达式
f ( x ) = ∑ i = 1 N − x i sin ( ∣ x i ∣ ) f(x)=\sum_{i=1}^{N}-x_{i}\sin (\sqrt{\left | x_{i} \right | } ) f ( x ) = i = 1 ∑ N − x i sin ( ∣ x i ∣ ) − 500 ≤ x i ≤ 500 , i = 1 , 2 , . . . , N -500 \le x_{i} \le 500,i=1,2,...,N − 500 ≤ x i ≤ 500 , i = 1 , 2 , ... , N 1.5.2 特征
x i = 420.9687 时有一个全局最小值 − n × 418.9839 x_{i}=420.9687时有一个全局最小值-n\times 418.9839 x i = 420.9687 时有一个全局最小值 − n × 418.9839 1.5.3 图像
2. PSO(Particle swarm optimization)
2.1 解决的问题
2.2 API
Copy class PSO ( SkoBase ):
def __init__ ( self , func , n_dim = None , pop = 40 , max_iter = 150 , lb =- 1e5 , ub = 1e5 , w = 0.8 , c1 = 0.5 , c2 = 0.5 ,
constraint_eq = tuple (), constraint_ueq = tuple (), verbose = False
, dim = None ):...
2.3 参数
参数详解:
惯性权重w描述粒子上一代速度对当前代速度的影响。w 值较大,全局寻优能力强,局部寻优能力弱;反之,则局部寻优能力强。 当问题空间较大时,为了在搜索速度和搜索精度之间达到平衡,通常做法是使算法在前期有较高的全局搜索能力以得到合适的种子,而在后期有较高的局部搜索能力以提高收敛精度。所以w不宜为一个固定的常数。
个体学习因子c1 =0称为无私型粒子群算法,即“只有社会,没有自我”,会迅速丧失群体多样性,容易陷入局部最优解而无法跳出;社会学习因子c2=0称为自我认识型粒子群算法,即“只有自我,没有社会”,完全没有信息的社会共享,导致算法收敛速度缓慢; c1,c2都不为0,称为完全型粒子群算法,完全型粒子群算法更容易保持收敛速度和搜索效果的均衡,是较好的选择。通常设置c1=c2=2,但不一定必须等于2,通常c1=c2∈[0,4]。
群体大小pop是一个整数,pop很小时陷入局部最优解的可能性很大;pop很大时PSO的优化能力很好, 但是当群体数目增长至一定水平时,再增长将不再有显著作用,而且数目越大计算量也越大。群体规模pop一般取20~40,对较难或特定类别的问题 可以取到100~200。
2.4 示例
2.4.1 不带约束条件
Copy # 导入必要的库,定义函数
import sko . PSO as PSO
import numpy as np
import matplotlib . pyplot as plt
def Schwefel ( x ):
'''
Schwefel's 函数,自变量为一个n维向量
该向量的每一个分量 -500<=x(i)<=500
当自变量的每一个分量的值为420.9687,有一个全局最小值为 -n*418.9839
'''
# 初始化函数值 z 为0
z = 0
# 遍历每个分量
for i in range ( 1 , x.size + 1 ):
# 计算函数值 z
z = z - x [ i - 1 ] * np . sin (np. sqrt (np. abs (x[i - 1 ])))
# 返回目标函数值
return z
# 使用粒子群算法求解 Schwefel 函数的最小值
# 创建 PSO 对象 ex_pso,维度为 3,种群规模为 400,最大迭代次数为 200
# 变量的上下界为-500到500,惯性权重为1,个体和全局学习参数 c1 和 c2 都为2
ex_pso = PSO . PSO (func = Schwefel,n_dim = 3 ,pop = 400 ,
max_iter = 200 ,lb = [ - 500 , - 500 , - 500 ,],
ub = [ 500 , 500 , 500 ,],w = 1 ,c1 = 2 ,c2 = 2 )
# 执行 PSO 算法
ex_pso . run ()
# 输出找到的最佳解
print ( 'best_x is ' , ex_pso.gbest_x, 'best_y is' , ex_pso.gbest_y)
# 可视化迭代过程
# 绘制历史最佳解的变化曲线
plt . plot (ex_pso.gbest_y_hist)
# 保存并显示图像
plt . savefig ( "PSO for Schwefel.png" ,dpi = 300 )
plt . show ()
Copy best_x is [ 425.69669626 421.40732833 425.7049067 ] best_y is [ -1251.26934821 ]
2.4.2 带约束条件
Copy # 导入必要的库,定义目标函数和约束条件
import sko . PSO as PSO
import numpy as np
import matplotlib . pyplot as plt
def Schwefel ( x ):
'''
Schwefel's 函数,自变量为一个n维向量
该向量的每一个分量 -500=<x(i)<=500
当自变量的每一个分量的值为420.9687
有一个全局最小值为 -n*418.9839
'''
# 初始化目标函数值 z 为0
z = 0
# 遍历每个分量
for i in range ( 1 , x.size + 1 ):
# 计算函数值 z
z = z - x [ i - 1 ] * np . sin (np. sqrt (np. abs (x[i - 1 ])))
# 返回目标函数值
return z
my_constrain_ueq = (
# 定义不等式约束条件,表示变量之间的关系
lambda x :(x [ 0 ] - 420 ) ** 2 + (x [ 1 ] - 420 ) ** 2 + (x [ 2 ] - 420 ) ** 2 - 500 ** 2 ,
)
# 使用粒子群算法求解带有不等式约束的 Schwefel 函数的最小值
# 创建 PSO 对象 ex_pso,维度为 3,种群规模为 400,最大迭代次数为 200
# 变量的上下界为-500到500,惯性权重为1,个体和全局学习参数 c1 和 c2 都为2
# 定义不等式约束
ex_pso = PSO . PSO (func = Schwefel,n_dim = 3 ,pop = 400 ,
max_iter = 200 ,lb = [ - 500 , - 500 , - 500 ,],
ub = [ 500 , 500 , 500 ,],w = 1 ,c1 = 2 ,c2 = 2 ,
constraint_ueq = my_constrain_ueq)
# 执行 PSO 算法
ex_pso . run ()
# 输出找到的最佳解
print ( 'best_x is ' , ex_pso.gbest_x, 'best_y is' , ex_pso.gbest_y)
# 可视化迭代过程
# 绘制历史最佳解的变化曲线
plt . plot (ex_pso.gbest_y_hist)
# 保存并显示图像
plt . savefig ( "PSO for Schwefel.png" ,dpi = 300 )
plt . show ()
Copy best_x is [ 421.25075001 421.6301641 422.22992202 ] best_y is [ -1256.68262677 ]
3.Genetic Algorithm(recommended)
3.1 解决的问题
TSP(Travelling Salesman Problem)问题
3.2 API
3.2.1 Genetic Algorithm
Copy class GA ( GeneticAlgorithmBase ):
"""genetic algorithm
Parameters
----------------
func : function
The func you want to do optimal
n_dim : int
number of variables of func
lb : array_like
The lower bound of every variables of func
ub : array_like
The upper bound of every variables of func
constraint_eq : tuple
equal constraint
constraint_ueq : tuple
unequal constraint
precision : array_like
The precision of every variables of func
size_pop : int
Size of population
max_iter : int
Max of iter
prob_mut : float between 0 and 1
Probability of mutation
"""
def __init__ ( self , func , n_dim ,
size_pop = 50 , max_iter = 200 ,
prob_mut = 0.001 ,
lb =- 1 , ub = 1 ,
constraint_eq = tuple (), constraint_ueq = tuple (),
precision = 1e-7 , early_stop = None ):...
调整这些参数可以对算法的性能产生影响,具体如下:
调整size_pop
:增加种群数量,可以增加搜索空间,但会导致计算代价增加。
调整max_iter
:增加迭代次数可以增加搜索空间,但会增加运行时间。
调整prob_mut
:增加个体基因突变的概率,可以增加种群的多样性,但会降低稳定性,易陷入局部最优解。
调整precision
:增加精度可以增加结果的精确度,但会增加计算时间和计算量。
调整约束条件:添加约束条件可以使得解更符合实际限制,但会增加计算复杂度。
调整early_stop
:合理设置提前终止算法的条件可以减少不必要的运行时间。
3.2.2 Genetic Algorithm for TSP(Travelling Salesman Problem)
Copy class GA_TSP ( GeneticAlgorithmBase ):
"""
Do genetic algorithm to solve the TSP (Travelling Salesman Problem)
Parameters
----------------
func : function
The func you want to do optimal.
It inputs a candidate solution(a routine), and return the costs of the routine.
size_pop : int
Size of population
max_iter : int
Max of iter
prob_mut : float between 0 and 1
Probability of mutation
"""
def __init__ ( self , func , n_dim , size_pop = 50 , max_iter = 200 , prob_mut = 0.001 ):...
3.3 TSP的目标函数定义的示例
首先,我们来讲解一下TSP问题是什么:TSP(Traveling Salesman Problem)指的是给定一个包含N个城市的地图,每对城市之间都有一个距离。现在需要找到一条路径,使得在该路径上每个城市仅仅只被经过一次,并且要求走过的总路程最小化。
那么,为了解决这个问题,需要先生成N个随机的城市,并计算它们之间的距离。(每个城市用一个坐标点表示,计算距离可以使用欧几里得距离公式)
针对上述问题,代码的流程可以描述如下:
最后,定义一个目标函数,计算按某种顺序依次经过这些城市的总路程。
按照这个思路,我们可以写出如下的代码:
Copy import numpy as np
# 随机生成50个两维点坐标
num_points = 50
points_coordinate = np . random . rand (num_points, 2 )
def get_distance ( x1 , x2 ):
"""计算两个点之间的欧几里得距离"""
return np . sqrt (np. sum (np. square (x1 - x2)))
# 根据城市坐标计算各个城市之间的距离
n = points_coordinate . shape [ 0 ]
distance_matrix = np . zeros ((n, n))
for i in range (n):
for j in range (n):
if i != j :
distance_matrix [ i , j ] = get_distance (points_coordinate[i], points_coordinate[j])
def cal_total_distance ( routine ):
'''The objective function. input routine, return total distance.
cal_total_distance(np.arange(num_points))
'''
# 按顺序经过所有城市的总路程
return np . sum ([distance_matrix[routine[i % num_points], routine[(i + 1 ) % num_points]] for i in range (num_points)])
# 测试
print ( cal_total_distance (np. arange (num_points)))
下面还有一个官方给出的版本,比较简洁:
Copy import numpy as np
from scipy import spatial
import matplotlib . pyplot as plt
num_points = 50
points_coordinate = np . random . rand (num_points, 2 ) # generate coordinate of points
distance_matrix = spatial . distance . cdist (points_coordinate, points_coordinate, metric = 'euclidean' )
def cal_total_distance ( routine ):
'''The objective function. input routine, return total distance.
cal_total_distance(np.arange(num_points))
'''
num_points , = routine . shape
return sum ([distance_matrix[routine[i % num_points], routine[(i + 1 ) % num_points]] for i in range (num_points)])
#测试
print ( cal_total_distance (np. arange (num_points)))
3.4 示例
3.5.1 目标函数优化
Copy # 导入需要的库
import sko
import matplotlib . pyplot as plt
import numpy as np
# 构造目标函数
def pin_func ( p ):
'''
一个针状函数,取值范围为 0 <= x, y <= 100
有一个最大值为1.1512在坐标(50,50)
'''
# 解析 p 向量,即 (x, y)
x , y = p
# 计算针状函数的结果
r = np . square ( (x - 50 ) ** 2 + (y - 50 ) ** 2 ) + np . exp ( 1 )
t = np . sin (r) / r + 1
# 转化为求最小值
return - 1 * t
# 使用遗传算法求解目标函数的最小值
# 构造遗传算法对象 ex_GA,大小为50,迭代次数为800次
ex_GA = sko . GA . GA (func = pin_func, n_dim = 2 , size_pop = 50 , max_iter = 800 , prob_mut = 0.001 ,
lb = [ 0 , 0 ,], ub = [ 100 , 100 ,], precision = 1e-7 )
# 执行遗传算法
best_x , best_y = ex_GA . run ()
# 输出找到的最优解
print ( 'best_x:' , best_x, '\n' , 'best_y:' , best_y)
# 可视化迭代过程
# 获取历史搜索最佳解序列
Y_history = ex_GA . all_history_Y
# 创建画布对象和子图对象
fig , ax = plt . subplots ( 2 , 1 )
# 绘制搜索的目标函数值的历史曲线
ax [ 0 ]. plot ( range ( len (Y_history)), Y_history, '.' , color = 'red' )
# 计算历史最小值的累积曲线
min_history = [np . min (Y_history[:i + 1 ]) for i in range ( len (Y_history)) ]
# 绘制历史最小值的累积曲线
ax [ 1 ]. plot ( range ( len (min_history)), min_history, color = 'blue' )
# 保存并显示图像
plt . savefig ( "GA.png" ,dpi = 400 )
plt . show ()
3.5.2 TSP
Copy # 导入必要的库
import numpy as np
from scipy import spatial
import matplotlib . pyplot as plt
# 随机生成点的数目
num_points = 50
# 生成随机坐标数组
points_coordinate = np . random . rand (num_points, 2 )
# 生成距离矩阵,即每对点之间的欧氏距离
distance_matrix = spatial . distance . cdist (points_coordinate, points_coordinate, metric = 'euclidean' )
# 定义目标函数
def cal_total_distance ( routine ):
'''计算旅行商问题的总距离,输入路线 routine,返回总距离
范例:cal_total_distance(np.arange(num_points))
'''
# 获取路线上的点的数目
num_points , = routine . shape
# 计算每对相邻点之间的距离之和
return sum ([distance_matrix[routine[i % num_points], routine[(i + 1 ) % num_points]] for i in range (num_points)])
# 使用遗传算法求解旅行商问题
import sko
# 创建 GA_TSP 类对象 ex_ga_tsp
ex_ga_tsp = sko . GA . GA_TSP (func = cal_total_distance, n_dim = num_points, size_pop = 50 , max_iter = 500 , prob_mut = 1 )
# 运行 GA 算法
best_points , best_distance = ex_ga_tsp . run ()
# 将结果进行可视化展示
# 绘制找到的最佳路线
fig , ax = plt . subplots ( 1 , 2 )
best_points_ = np . concatenate ([best_points, [best_points[ 0 ]]])
best_points_coordinate = points_coordinate [ best_points_ , :]
ax [ 0 ]. plot (best_points_coordinate[:, 0 ], best_points_coordinate[:, 1 ], 'o-r' )
# 绘制迭代过程中历代最佳总距离的变化曲线
ax [ 1 ]. plot (ex_ga_tsp.generation_best_Y)
# 保存并显示图像
plt . savefig ( "GA_TSP.png" ,dpi = 400 )
plt . show ()
4.Differential Evolution
4.1 解决的问题
4.2 API
Copy class DE ( GeneticAlgorithmBase ):
def __init__ ( self , func , n_dim , F = 0.5 ,
size_pop = 50 , max_iter = 200 , prob_mut = 0.3 ,
lb =- 1 , ub = 1 ,
constraint_eq = tuple (), constraint_ueq = tuple () ):...
4.3 参数
调整这些参数会对算法的收敛速度、性能和精度产生影响:
F
的调整会影响算法的收敛速度和性能,在实际应用中,通常取值范围在[0.5, 1]之间,较小的值会降低算法的收敛速度,较大的值会提高算法的性能但易于陷入局部最优。
size_pop
的调整会影响算法的搜索范围和精度,在实际应用中,通常取值范围在[10, 100]之间,较小的值会降低算法的搜索范围和精度,较大的值会提高算法的搜索范围但易于陷入局部最优。
max_iter
的调整会影响算法的收敛速度和性能,在实际应用中,通常取值范围在[50, 1000]之间,较小的值会降低算法的收敛速度,较大的值会提高算法的性能但易于陷入局部最优。
prob_mut
的调整会影响算法的搜索范围和精度,在实际应用中,通常取值范围在[0.2, 0.5]之间,较小的值会降低算法的搜索范围和精度,较大的值会提高算法的搜索范围但易于陷入局部最优。
lb
和ub
的调整会影响算法的搜索范围和精度,较宽的取值范围会提高算法的搜索范围但易于陷入局部最优,较窄的取值范围会提高算法的精度但易于陷入搜索空间的局限性。
4.4 示例
Copy # 导入必要的模块
import numpy as np
import sko
# 定义 Branin's rcos 函数
# 输入参数为 p = [x, y],其中 -5 <= x <= 10, 0 <= y <= 15
# 函数的三个最小值为 (x, y) = (-pi, 12.275), (pi, 2.275), (9.42478, 2.475),对应的函数值为 0.397887
# 函数还有一个局部最小值为 0.8447
def Brains_rcos ( p ):
x , y = p
z = (y - 51 * (x ** 2 ) / ( 40 * np . pi ** 2 ) + 5 * x / np . pi - 6 ) ** 2 + 10 * ( 1 - 1 / ( 8 * np . pi)) * np . cos (x) + 10
return z
# 使用 Differential Evolution(DE)算法求解 Branin's rcos 函数
# 设定搜索空间为 2 维,种群大小为 50,最大迭代次数为 800
# 搜索空间的下界为 [-5, 0],上界为 [10, 15]
ex_DE = sko . DE . DE (func = Brains_rcos, n_dim = 2 , size_pop = 50 , max_iter = 800 , lb = [ - 5 , 0 ,], ub = [ 10 , 15 ,])
# 运行 Differential Evolution 算法,获取最优解及其对应的函数值
best_x , best_y = ex_DE . run ()
# 打印最优解的取值和相应的函数值
print ( 'best_x:' , best_x, '\n' , 'best_y:' , best_y)
Copy best_x: [9.42477795 2.47499997]
best_y: [0.39788736]
特别篇:GA与DE的区别
差分进化算法(Differential Evolution,DE)和遗传算法(Genetic Algorithm,GA)都是优化问题的常用解法,它们本质上都是一种基于种群的进化算法。但是从算法的具体实现角度来看,它们之间存在一些区别,包括:
变异操作的方式:DE是通过差分操作对整个种群进行变异,而GA是通过单点交叉、多点交叉、变异等操作对个体进行变异。
交叉操作的方式:DE不使用交叉操作,而GA是通过交叉操作将两个个体的染色体交换基因片段。
参数的个数:DE只有 3 个参数(个体数、变异概率、缩放因子),而GA有更多的参数,如交叉概率、变异概率、选择算法、染色体长度等。
算法的收敛速度:DE通过局部搜索和全局搜索相结合的方式,通常能够在较少的迭代次数内得到较为理想的全局最优解;而GA通常较难避免陷入局部最优解,收敛速度可能会比DE慢。
总的来说,DE更适合处理具有连续性的目标函数,对噪声和非线性函数的适应性非常强,而GA更适合解决具有离散性或组合性质的优化问题,如旅行商问题等。
5.SA(Simulated Annealing)
5.1 解决的问题
TSP(Travelling Salesman Problem)问题
5.2 API
5.2.1 Simulated Annealing
Copy class SAFast ( SimulatedAnnealingValue ):
def __init__ ( self , func , x0 , T_max = 100 , T_min = 1e-7 , L = 300 , max_stay_counter = 150 , ** kwargs ):...
参数详解:
func:优化器所要优化的目标函数。它是一个接受输入参数x并返回实数值的函数。
x0:优化器的起始点,它是一个长度为n的列表,n为目标函数的自变量数量。
T_max:初始温度的上限。在退火过程中,温度将不断地减小,直到小于等于T_min。T_max的大小决定了退火过程中的起始温度,取值较高可以使得更多的移不动的状态被接受,但同时可能导致计算时间增加和结果不稳定。
T_min:温度的下限。当温度降到T_min以下时,退火过程结束。T_min的大小影响退火过程的终止时间以及最终结果的质量,通常情况下应该设置为一个很小的正数,并与目标函数的值域有关。
L:每个温度下的迭代次数。每次迭代中,优化器从当前点x尝试随机扰动得到一个新的点x_new,如果目标函数值变小,则接受x_new作为新的点;否则以一定概率接受该点以避免陷入局部最小值。L的大小决定每个温度下的计算量,取值过小可能导致结果不充分,取值过大可能导致计算时间增加。
max_stay_counter:接受状态的最大连续次数。如果连续生成的L个新状态都没有比当前状态更优,则认为算法已经陷入局部极小值,此时退出迭代,返回当前状态作为最优解。max_stay_counter的大小影响算法的全局搜索能力,设定过小可能导致算法过早退出,在局部极小值附近震荡,设定过大可能导致算法无法收敛于正确解。
调整这些参数会对模拟退火算法的性能和结果产生影响,一般地:
如果发现算法很难找到可接受的状态,可适当提高T_max并减小L,以增加接受状态的可能性,并减少在状态空间中锁定的时间。
如果想缩短算法时间或者降低计算量、并行化搜索过程,可以减小L、max_stay_counter或T_max等参数,以减少每个温度下的迭代次数、搜索到的状态数或搜索的状态空间范围。
如果想得到更精确的结果,可以增加L、max_stay_counter或T_min等参数,以扩大搜索范围或提高算法在搜索到局部最优解后跳出局部最优解的概率。
5.2.2 SA for TSP
Copy class SimulatedAnnealingBase ( SkoBase ):
def __init__ ( self , func , x0 , T_max = 100 , T_min = 1e-7 , L = 300 , max_stay_counter = 150 , ** kwargs ):...
class SA_TSP ( SimulatedAnnealingBase ):...
5.3 示例
5.3.1 目标函数优化
Copy # 导入numpy库,函数部分实现依赖numpy
import numpy as np
# 定义Griewank函数
def Griewank ( x ):
'''
Griewank函数, 在x=(0, 0, ..., 0)处有全局极小值0,
-600<=x<=600, x为向量,维数可任意大小
'''
# 计算第一项
y1 = np . sum (x ** 2 / 4000 )
y2 = 1
# 计算第二项
for i in range ( 1 , x.size + 1 ):
y2 = y2 * np . cos (x[i - 1 ] / np. sqrt (i))
# 返回Griewank函数值
return y1 - y2 + 1
# 导入sko库,这里是使用SA算法
import sko
# 初始化SA模拟退火算法类,并为其提供Griewank函数作为优化目标,以及初始值x0、其他配置参数(最大温度T_max、最小温度T_min、链长L、最大停留次数max_stay_counter、函数参数下界lb、函数参数上界ub)
ex_sa = sko . SA . SA (func = Griewank, x0 = [ 1 , 1 , 1 ], T_max = 1 , T_min = 1e-9 , L = 300 , max_stay_counter = 150
,lb = [ - 600 , - 600 , - 600 ,],ub = [ 600 , 600 , 600 ,])
# 运行模拟退火算法,并获取最优的x值和对应的函数值y
best_x , best_y = ex_sa . run ()
# 输出当前模拟得到的最优的x值和最优的函数值y
print ( 'best_x:' , best_x, 'best_y' , best_y)
# 导入matplotlib.pyplot库和pandas库,用于绘制数据可视化效果
import matplotlib . pyplot as plt
import pandas as pd
# 绘制最优结果历史的累计最小值(画图并保存)。累计最小值表示在每个时间点之前,所有的数据中的最小值(而不是在特定时间点的最小值)。
# 通过cummin方法计算,在“axis=0”的方向上进行累计最小值计算。这里,axis=0 表示跨行(沿着第0轴)进行计算
plt . plot (pd. DataFrame (ex_sa.best_y_history). cummin (axis = 0 ))
# 保存并显示图像
plt . savefig ( "SA.png" ,dpi = 400 )
plt . show ()
5.3.2 TSP
Copy # 导入必要的库
import numpy as np
from scipy import spatial
import matplotlib . pyplot as plt
# 随机生成点的数目
num_points = 10
# 生成随机坐标数组
points_coordinate = np . random . rand (num_points, 2 )
# 生成距离矩阵,即每对点之间的欧氏距离
distance_matrix = spatial . distance . cdist (points_coordinate, points_coordinate, metric = 'euclidean' )
# 定义目标函数
def cal_total_distance ( routine ):
'''
计算旅行商问题的总距离,输入路线routine,返回总距离
范例:cal_total_distance(np.arange(num_points))
'''
# 获取路线上的点的数目
num_points , = routine . shape
# 计算每对相邻点之间的距离之和
return sum ([distance_matrix[routine[i % num_points], routine[(i + 1 ) % num_points]] for i in range (num_points)])
# 导入SA_TSP算法函数
from sko . SA import SA_TSP
# 初始化SA_TSP算法类,并为其提供生成的目标函数cal_total_distance、初始路线x0、温度参数T_max, T_min和其他配置参数(链长L)
sa_tsp = SA_TSP (func = cal_total_distance, x0 = range (num_points), T_max = 100 , T_min = 1 , L = 10 * num_points)
# 运行模拟退火算法,并获取最优的路线best_points及对应的距离best_distance
best_points , best_distance = sa_tsp . run ()
# 输出运行的结果
print (best_points, best_distance, cal_total_distance (best_points))
# 以下代码用于绘制最优路线的可视化效果
# 导入FormatStrFormatter库
from matplotlib . ticker import FormatStrFormatter
# 创建两张画布
fig , ax = plt . subplots ( 1 , 2 )
best_points_ = np . concatenate ([best_points, [best_points[ 0 ]]])
best_points_coordinate = points_coordinate [ best_points_ , :]
# 绘制距离迭代历史的折线图
ax [ 0 ]. plot (sa_tsp.best_y_history)
ax [ 0 ]. set_xlabel ( "Iteration" )
ax [ 0 ]. set_ylabel ( "Distance" )
# 绘制最优路线的散点图
ax [ 1 ]. plot (best_points_coordinate[:, 0 ], best_points_coordinate[:, 1 ],
marker = 'o' , markerfacecolor = 'b' , color = 'c' , linestyle = '-' )
ax [ 1 ]. xaxis . set_major_formatter ( FormatStrFormatter ( ' %.3f ' ))
ax [ 1 ]. yaxis . set_major_formatter ( FormatStrFormatter ( ' %.3f ' ))
ax [ 1 ]. set_xlabel ( "Longitude" )
ax [ 1 ]. set_ylabel ( "Latitude" )
# 保存并显示图像
plt . savefig ( "SA_TSP.png" ,dpi = 400 )
plt . show ()
5.4 bug
本人发现在使用SA_TSP的途中,只要问题的复杂度上升,SA_TSP几乎必定会给出错误的结果。在上面的例子中,我只给出了10个点位,这时的SA_TSP看起来适应地很好。但是,当我把点位增加到50,SA_TSP给出了如下的错误结果:
6.ACA (Ant Colony Algorithm) for tsp
6.1 解决的问题
TSP(Travelling Salesman Problem)问题
6.2 API
Copy class ACA_TSP :
def __init__ ( self , func , n_dim ,
size_pop = 10 , max_iter = 20 ,
distance_matrix = None ,
alpha = 1 , beta = 2 , rho = 0.1 ,
):...
6.3 参数
size_pop
:种群规模对算法的效率和精度有很大的影响。种群规模越大,算法在搜索空间中的覆盖率越高,但相应的计算开销也越大,运行时间和内存开销也会增加。如果种群规模过小,算法可能会陷入局部最优解,从而影响算法的质量。
max_iter
:迭代次数越多,算法对解的搜索空间越广,容易得到更优的解,但是也会消耗更多的计算资源,从而影响算法的运行效率。
distance_matrix
:距离矩阵的准确性对算法的精度和运行效率有很大影响。如果距离矩阵不准确,算法可能会得到错误的结果,从而影响算法的质量。距离矩阵的计算也需要很大的计算开销,如果距离矩阵过于复杂,算法的运行效率也会受到影响。
alpha
和beta
:信息素重要程度因子和启发函数重要程度因子都可以影响算法的全局搜索能力和局部搜索能力。信息素重要程度因子越大,蚂蚁走过的路径上信息素的影响越大,算法的全局搜索能力越强,但是局部搜索能力会弱化。启发函数重要程度因子越大,蚂蚁选择路径时更加倾向于走近目标城市,因此算法的局部搜索能力会增强,但是全局搜索能力会弱化。
rho
:信息素挥发程度因子主要用于控制信息素的更新速度。如果挥发程度因子设置得过大,信息素的更新速度会很快,导致算法的不稳定性增加;如果设置得过小,信息素的更新速度会很慢,影响算法的收敛速度。
需要根据具体问题的特点和问题需求来选择和调整参数。
6.4 示例
Copy # 导入常用库
import numpy as np
from scipy import spatial
import matplotlib . pyplot as plt
import pandas as pd
# 设定待确定节点的数量为50
num_points = 50
# 随机生成50个在[0,1)之间的点
# points_coordinate[i][0]、points_coordinate[i][1]是第i个点的x,y坐标
points_coordinate = np . random . rand (num_points, 2 )
# 采用欧几里得距离度量计算每两个点之间的距离生成一个距离矩阵
# distance_matrix[i][j]是第i个点与第j个点之间的距离
distance_matrix = spatial . distance . cdist (points_coordinate, points_coordinate, metric = 'euclidean' )
# 目标函数: 输入一个排列向量,返回TSP问题中按该排列顺序访问所有点后的总距离
def cal_total_distance ( routine ):
'''The objective function. input routine, return total distance.
cal_total_distance(np.arange(num_points))
'''
# 计算访问所有点所需的总距离
num_points , = routine . shape
return sum ([distance_matrix[routine[i % num_points], routine[(i + 1 ) % num_points]] for i in range (num_points)])
# 导入ACA_TSP蚁群算法,将目标函数、节点数量、种群数量、迭代次数、距离矩阵等参数传入该算法对象中
from sko . ACA import ACA_TSP
aca = ACA_TSP (func = cal_total_distance, n_dim = num_points,
size_pop = 50 , max_iter = 200 ,
distance_matrix = distance_matrix)
# 运行蚁群算法,寻找最优解
best_x , best_y = aca . run ()
# 输出结果
print (best_x,best_y)
# 画出路径和迭代过程中最优解的变化,保存图片并显示
fig , ax = plt . subplots ( 1 , 2 )
#合并最优路径
best_points_ = np . concatenate ([best_x, [best_x[ 0 ]]])
best_points_coordinate = points_coordinate [ best_points_ , :]
# 画出最优路径
ax [ 0 ]. plot (best_points_coordinate[:, 0 ], best_points_coordinate[:, 1 ], 'o-r' )
# 画出迭代过程中最优解的变化
pd . DataFrame (aca.y_best_history). cummin (). plot (ax = ax[ 1 ])
plt . savefig ( "ACA_TSP.png" ,dpi = 400 )
plt . show ()
7.immune algorithm (IA)
7.1 解决的问题
TSP(Travelling Salesman Problem)问题
7.2 API
Copy class IA_TSP (GA_TSP):
def __init__ ( self , func , n_dim , size_pop = 50 , max_iter = 200 , prob_mut = 0.001 , T = 0.7 , alpha = 0.95 ):...
7.3 参数
size_pop:增加种群数量可能会导致更多的个体能够探索更广阔的解空间,但是也会增加算法的计算时间和消耗的内存。
max_iter:增加迭代次数可能会导致更好的解或计算时间更长。
prob_mut:增加突变概率能够使算法更有机会在探索过程中跳出局部最优解,但是也会增加计算复杂度。
T:增加初始温度可能会使算法能够更快地探索解空间,但是也可能导致算法探索不够全面或收敛不够彻底。
alpha:增加温度下降比例可以加速算法的收敛速度,但是也可能导致算法过早收敛到次优解。
7.4 示例
Copy # 导入常用库
import numpy as np
from scipy import spatial
import matplotlib . pyplot as plt
# 设定待确定节点的数量为50
num_points = 50
# 随机生成50个在[0,1)之间的点
# points_coordinate[i][0]、points_coordinate[i][1]是第i个点的x,y坐标
points_coordinate = np . random . rand (num_points, 2 )
# 采用欧几里得距离度量计算每两个点之间的距离生成一个距离矩阵
# distance_matrix[i][j]是第i个点与第j个点之间的距离
distance_matrix = spatial . distance . cdist (points_coordinate, points_coordinate, metric = 'euclidean' )
# 目标函数: 输入一个排列向量,返回TSP问题中按该排列顺序访问所有点后的总距离
def cal_total_distance ( routine ):
'''The objective function. input routine, return total distance.
cal_total_distance(np.arange(num_points))
'''
# 计算访问所有点所需的总距离
num_points , = routine . shape
return sum ([distance_matrix[routine[i % num_points], routine[(i + 1 ) % num_points]] for i in range (num_points)])
# 导入IA_TSP蚁群算法,将目标函数、节点数量、种群数量、迭代次数、交叉概率、变异概率等参数传入该算法对象中
from sko . IA import IA_TSP
ia_tsp = IA_TSP (func = cal_total_distance, n_dim = num_points, size_pop = 500 , max_iter = 800 , prob_mut = 0.2 ,
T = 0.7 , alpha = 0.95 )
# 运行蚁群算法,寻找最优解
best_points , best_distance = ia_tsp . run ()
# 输出结果
print ( 'best routine:' , best_points, 'best_distance:' , best_distance)
# 画出路径和迭代过程中最优解的变化,保存图片并显示
fig , ax = plt . subplots ( 1 , 2 )
# 合并最优路径
best_points_ = np . concatenate ([best_points, [best_points[ 0 ]]])
best_points_coordinate = points_coordinate [ best_points_ , :]
# 画出最优路径
ax [ 0 ]. plot (best_points_coordinate[:, 0 ], best_points_coordinate[:, 1 ], 'o-r' )
# 画出迭代过程中最优解的变化
ax [ 1 ]. plot (ia_tsp.generation_best_Y)
# 保存图片并显示
plt . savefig ( "IA_TSP.png" ,dpi = 400 )
plt . show ()
8.Artificial Fish Swarm Algorithm (AFSA)
8.1 解决的问题
8.2 API
Copy class AFSA :
def __init__ ( self , func , n_dim , size_pop = 50 , max_iter = 300 ,
max_try_num = 100 , step = 0.5 , visual = 0.3 ,
q = 0.98 , delta = 0.5 ):...
8.3 参数
更新解的相关参数,控制上一次最优解和当前最优解的距离
这些参数的调整会影响AFSA算法的收敛性、全局最优解的寻优效果以及时间成本。具体来说:
size_pop:一般来说,种群数量越大,能够全局搜索的能力就越强,但同时也会增加计算时间和内存消耗。如果时间和内存资源允许,可以考虑适当增加该参数的值。
max_iter:迭代次数过低可能导致算法收敛不到最优解,而迭代次数过高可能会浪费计算时间,同时也可能陷入局部最优解而无法跳出。需要根据实际问题进行调节。
max_try_num:该参数的增加会增加算法迭代所需的时间,但同时可以增加算法跳出局部最优解的可能性。如果算法收敛不到最优解,可以适当增加该参数的值。
step:如果步长设置过大,算法可能会在搜索过程中快速跳过最优解附近的板块,从而无法找到最优解。如果步长过小,算法搜索效率较低。需要根据具体问题进行调节。
visual:可视化界面可以帮助理解算法搜索过程以及寻优效果,但同时也会占用计算资源。可以根据具体需求进行调节。
q:较低的q值会减缓温度(降温)的下降速度,可能会导致算法长时间在局部最优解周围徘徊。较高的q值将降温速度加快,可能有助于算法跳出局部最优解,但同时也可能会降低算法全局优化的精度。需要根据实际问题进行调节。
delta:delta参数越大,跳出局部最优解的可能性越大,但同时可能会增加算法的计算时间和空间复杂度。如果算法很难跳出局部最优解,可以适当增加该参数的值。
8.4 示例
Copy # 导入常用库
import numpy as np
# 目标函数,输入一个二元向量(p), 返回Easom's函数在该点的函数值
def Easom_s ( p ):
'''
Easom's函数,-100<=x<=100, -100<=y<=100
有一个全局最小值-1在坐标(pi,pi)
'''
x , y = p
z = - np . cos (x) * np . cos (y) * np . exp ( - ((x - np.pi) ** 2 + (y - np.pi) ** 2 ))
return z
# 导入AFSA优化算法,将目标函数、变量维度、种群大小、最大迭代次数、最大尝试次数、步长、可视化参数、
# 温度下降速率、步长下降速率等参数传入该算法对象中
from sko . AFSA import AFSA
afsa = AFSA (func = Easom_s, n_dim = 2 , size_pop = 50 , max_iter = 300 ,
max_try_num = 100 , step = 5 , visual = 0.3 ,
q = 0.98 , delta = 1 )
# 运行算法计算最优解
best_x , best_y = afsa . run ()
# 输出结果
print (best_x, best_y)
Copy [ 3.14173594 3.14302929] -0.9999968733295336
如果把步长缩小成0.5,delta缩小成0.5,那么这个算法针对Easom's函数给出了错误的答案
Copy [ 1.30500828 1.30513779] -8.110222525091613e-05